The accuracy of any survey depends on several key factors that influence how well the results reflect the true opinions of the entire population being studied. In our case, we are studying the entire population of our ICU nurses (finite population). Here are the main components that determine survey accuracy:
- Total Population – (N). For the purposes of this survey, N=145 (highest number of RNs employed in our ICU minus 5 (five) RNs who have indicated that they have no opinion on issues raised by the survey). 150-5=145.
- Sample Size – (n). The number of our ICU RNs who completed the survey. In our case n=111.
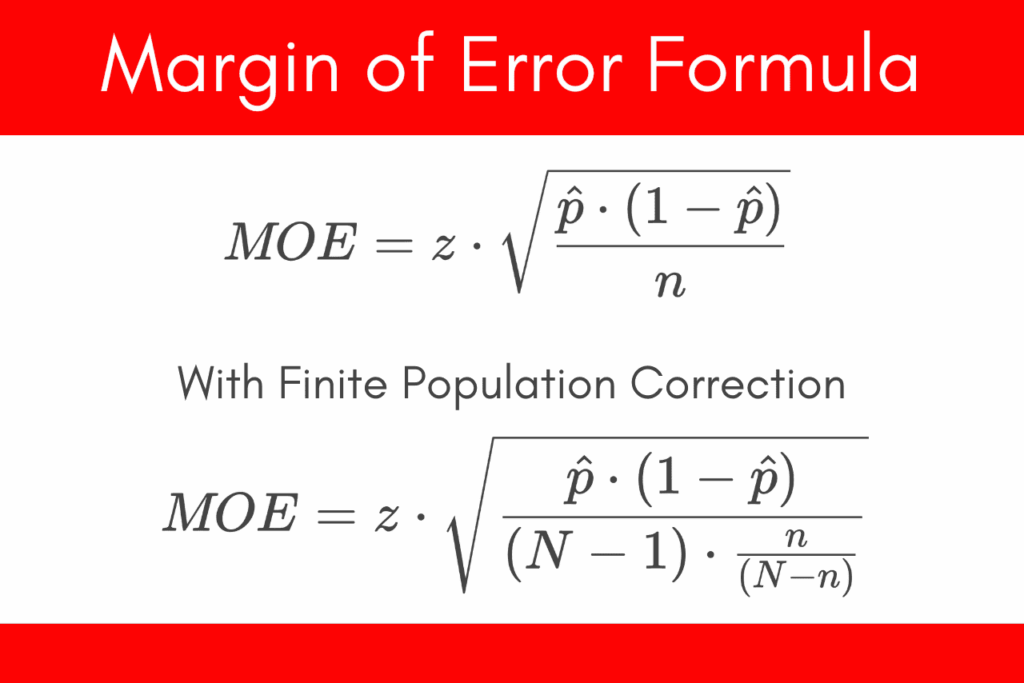
- P-score (Population Correction). In our case because we have Finite Population of 145 RNs, more precise finite population formula was used to determine the Margin of Error (MOE) for statistical analysis of responses to each survey question. See MOE formulas below. The p-score represents the percentage fraction of nurses who have responded a survey question in a certain way. For example, a proportion showing the relationship between “yes” and “no” answers to a survey question in terms of percentages. If 20% of people responded “yes” and 80% responded “no”, the population proportion for “Yes” answers is 0.2 (p=0.2), and for “No” answers is 0.8 (p=0.8)
- Sampling Method (Method by which Survey responders were selected). Random Sampling is the best way to ensure fairness where every member of the entire population has an equal chance of being selected. As it applies to our case, every ICU nurse was encouraged to participate, and equal participation opportunity was provided to almost all nurses except very few nurses who were unreachable d/t various factors such as being on disability leave for example. Since these nurses were included in a total count of 145 nurses, our survey results were not affected by their absence. Overall, in our case a sample size of 111 out of 145 total achieves a high level of statistical accuracy that ensures robust and representative results. This exceeds common industry standards for survey reliability in small populations.
- Margin of Error (MOE) – measures the range of values above and below of each survey question’s results that are likely to contain the true population value. Because in our survey we have many questions, a separate statistical analysis was performed for each question reflecting accurate and unique MOE for every single opinion-seeking question
- Confidence Level (represented by “z-score”) – the probability that the true population value falls within the margin of error. For example, for 95% Confidence level z=1.96 , and for 99% Confidence level z=2.576. In our case for the purposes of statistical analysis, we chose the 99% Confidence level to ensure the highest possible accuracy and reliability of our survey.
- Response Rate – A low response rate (when many people are not answering) can introduce bias if those who respond differ significantly from those who don’t. In other words, “it refers to the systematic differences between those who participate in a survey or study and those who do not”. In our case, response rate was very high. Total 111 out of 145 of our ICU nurses have participated. Five nurses were excluded from total count because they have indicated that they don’t have an opinion on any of the issues raised by the Survey questions, and are neutral with respect to these issues. Overall, as mentioned above, a response rate in our case exceeds common industry standards for survey reliability in small populations while delivering crystal clear insights. Moreover, for a survey items of crucial importance involving Action Team participation, in addition to industry standard analysis, the analysis assuming maximum bias favoring the opposition was performed and published as well.
- Here are the standard scientific formulas used to determine the Margin of Error for each survey question as it applies to the entire population of our ICU Nurses: